I want to get back into the swing of doing Emacs Chats again, which means scheduling, which means timezones. Let's see first if anyone happens to match up with the Thursday timeslots (10:30 or 12:45) that I'd like to use for Emacs-y video things, but I might be able to shuffle things around if needed.
I want something that can translate times into people's local timezones.
I use Org Mode timestamps a lot because they're so easy to insert with C-u C-c ! (org-timestamp-inactive), which inserts a timestamp like this:
By default, the Org HTML export for it does not include the timezone offset. That's easily fixed by adding %z to the time specifier, like this:
Now a little bit of Javascript code makes it clickable and lets us toggle a translated time. I put the time afterwards so that people can verify it visually. I never quite trust myself when it comes to timezone translations.
: Simplified getting a section or finding the bolded text by using the Org Mode format instead.
During the sessions with my French tutor, I share a Google document so that we can mark the words where I need to practice my pronunciation some more or tweak the wording. Using Ctrl+B to make the word as bold is an easy way to make it jump out.
I used to copy these changes into my Org Mode notes manually, but today I thought I'd try automating some of it.
First, I need a script to download the HTML for a specified Google document. This is probably easier to do with the NodeJS library rather than with oauth2.el and url-retrieve-synchronously because of various authentication things.
Je peux consacrer une petite partie de mon budget à des essais, mais je ne veux pas travailler davantage pour rentabiliser une dépense plus importante.
Je n'ai pas le temps de concentration nécessaire pour justifier l'investissement dans mon propre matériel, et sinon, les progrès sont trop rapides pour m'engager dans une configuration spécifique.
J'ai une conscience aiguë des limites cognitives ou physiques à cause des difficultés de santé de ma mère et de ma sœur, et de mes expériences avec mes limitations à cause du fait que je suis la personne principalement en charge de ma fille.
Je lis très vite, mais je n'ai pas assez de patience pour les longs contenus vidéo ou audio.
Je n'aime pas les textes qui contiennent beaucoup de remplissage.
Beaucoup de gens ont une réaction forte contre l'IA pour plusieurs raisons qui incluent le battage médiatique excessif dont elle fait l'objet, son utilisation à mauvais escient, et l'inondation de banalité qu'elle produit.
Je réécris souvent la majorité du logiciel à l'exception d'un ou deux morceaux parce que ce code ne me convient pas.
Je ne veux pas l'utiliser pour les correctifs que je veux soumettre à d'autres projets parce que le code ne me semble pas correct et je ne veux pas gaspiller le temps d'autres bénévoles.
J'aime pouvoir lui donner trois dépôts git et des instructions pour générer un logiciel à partir d'un dépôt pour un autre via le troisième dépôt.
Mais je ne veux pas le publier avant de réécrire et tout comprendre.
Je veux profiter davantage, apprendre davantage avec l'aide de vraies personnes, complétée par l'aide de l'IA.
J'adore les sous-titres simultanés, mais je n'ai pas toujours trouvé une méthode ou un système qui me convienne.
I can then go into the WhisperX transcription JSON file and replay those parts for closer review.
I can also tweak the context function to give me less information. For example, to limit it to the containing phrase, I can do this:
(defunmy-split-string-keep-delimiters (string delimiter)
(when string
(let (results pos)
(with-temp-buffer
(insert string)
(goto-char (point-min))
(setq pos (point-min))
(while (re-search-forward delimiter nil t)
(push (buffer-substring pos (match-beginning 0)) results)
(setq pos (match-beginning 0)))
(push (buffer-substring pos (point-max)) results)
(nreverse results)))))
(ert-deftestmy-split-string-keep-delimiters ()
(should
(equal (my-split-string-keep-delimiters
"Beaucoup de gens ont une réaction forte contre l'IA pour plusieurs raisons qui *incluent* le battage médiatique excessif dont elle fait l'objet, son utilisation à mauvais escient, et *l'inondation de banalité* qu'elle produit."", \\| que \\| qui \\| qu'ils? \\| qu'elles? \\| qu'on "
)
)))
(defunmy-lang-words-for-review-phrase-context (&optional s)
(setq s (replace-regexp-in-string " "" " (or s (sentence-at-point))))
(string-join
(seq-filter (lambda (s) (string-match "\\*" s))
(my-split-string-keep-delimiters s ", \\| parce que \\| que \\| qui \\| qu'ils? \\| qu'elles? \\| qu'on \\| pour "))
" ... "))
(ert-deftestmy-lang-words-for-review-phrase-context ()
(should
(equal (my-lang-words-for-review-phrase-context
"Je peux consacrer une petite partie de mon *budget* à des essais, mais je ne veux pas travailler davantage pour rentabiliser une dépense plus importante.")
"Je peux consacrer une petite partie de mon *budget* à des essais")))
Je peux consacrer une petite partie de mon budget à des essais
, et sinon
J'ai une conscience aiguë des limites cognitives ou physiques à cause des difficultés de santé de ma mère et de ma sœur
pour les longs contenus vidéo ou audio.
Je n'aime pas les textes qui contiennent beaucoup de remplissage.
qui incluent le battage médiatique excessif dont elle fait l'objet … , et l'inondation de banalité
Je réécris souvent la majorité du logiciel à l'exception d'un ou deux morceaux
pour les correctifs … parce que le code ne me semble pas correct et je ne veux pas gaspiller le temps d'autres bénévoles.
pour un autre via le troisième dépôt.
Mais je ne veux pas le publier avant de réécrire et tout comprendre.
, je pourrais peut-être apprendre plus lentement avec l'aide d'Internet
, apprendre davantage avec l'aide de vraies personnes, complétée par l'aide de l'IA.
qui me convienne.
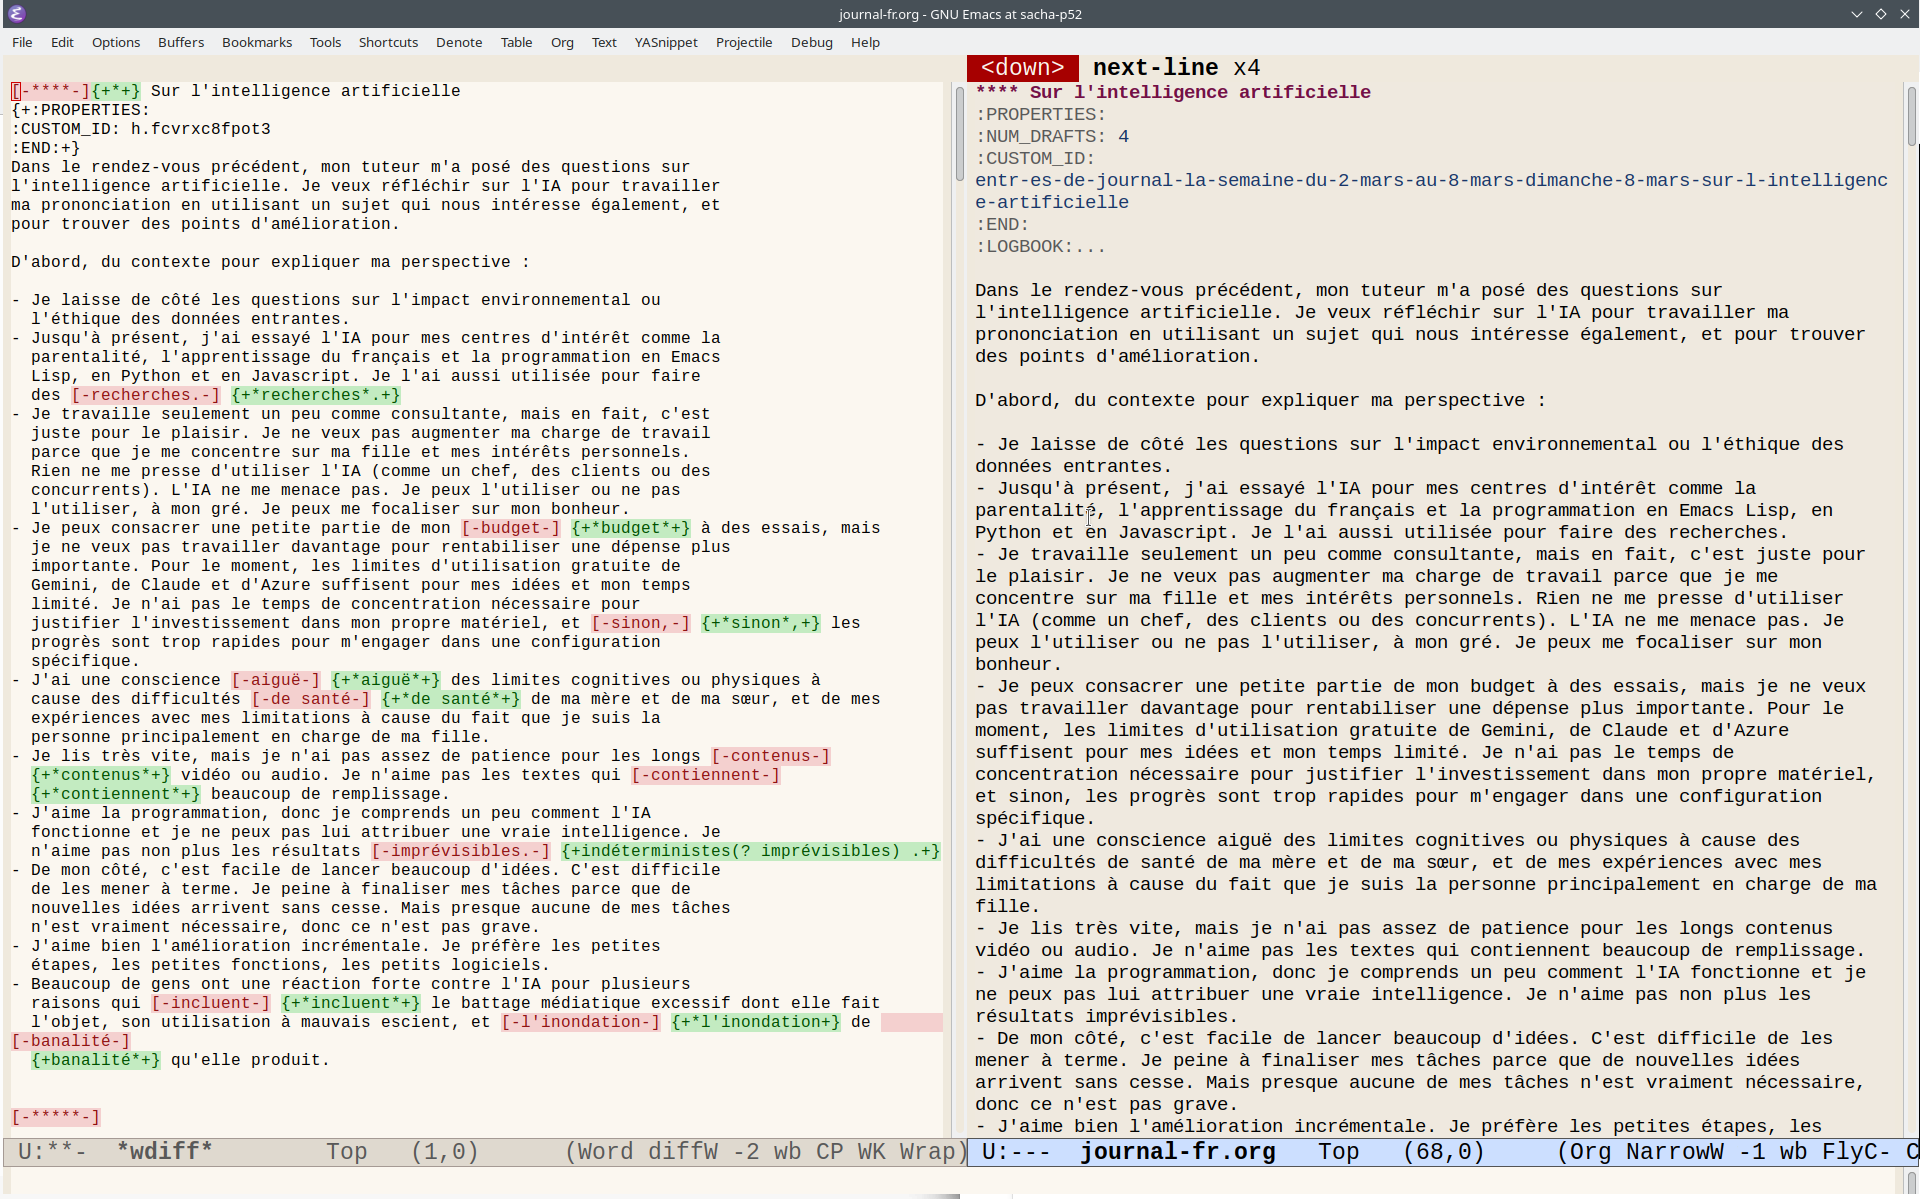
Now that I have a function for retrieving the HTML or Org Mode for a section, I can use that to wdiff against my current text to more easily spot wording changes.
The code might be a little adamant about
converting all the dates to America/Toronto:
11ty code for posts on this day
exportdefaultclass OnThisDay {
data() {
return {
layout: 'layouts/base',
permalink: '/blog/on-this-day/',
title: 'On this day'
};
}
async render(data) {
consttoday = newDate(newDate().toLocaleString('en-US', { timeZone: 'America/Toronto' }));
constoptions = { month: 'long', day: 'numeric' };
constdate = today.toLocaleDateString('en-US', options);
constcurrentMonthDay = today.toISOString().substring(5, 10);
letlist = data.collections._posts
.filter(post => {
constpostDateTime = newDate(post.date).toLocaleString('en-US', { timeZone: 'America/Toronto' });
constpostMonthDay = (newDate(postDateTime)).toISOString().substring(5, 10);
return postMonthDay === currentMonthDay;
})
.sort((a, b) => {
if (a.date < b.date) return 1;
if (a.date > b.date) return -1;
return 0;
})
.map(post => {
constpostDateTime = newDate(post.date).toLocaleString('en-US', { timeZone: 'America/Toronto' });
constpostDate = newDate(postDateTime);
constpostYear = postDate.getFullYear();
return`<li>${postYear}: <a href="${post.url}">${post.data.title}</a></li>`;
})
.join('\n');
list = list.length > 0
? `<ul>${list}</ul>`
: `<p>No posts were written on ${date} in previous years.</p>`;
return`<section><h2>On this day</h2><p>This page lists posts written on this day throughout the years. If you've enabled Javascript, it will show the current day. If you don't, it'll show the posts from the day I last updated this blog. You might also like to explore <a href="/blog/all">all posts</a>, <a href="/topic">a topic-based outline</a> or <a href="/blog/category">categories</a>.</p><h3 class="date">${date}</h3><div id="posts-container">${list}</div><script> $(document).ready(function() { onThisDay(); });</script></section>`;
}
};
Client-side Javascript for the dynamic list
function onThisDay() {
  const tz = 'America/Toronto';
  function getEffectiveDate() {
    const urlParams = new URLSearchParams(window.location.search);
    const dateParam = urlParams.get('date');
    if (dateParam && /^\d{2}-\d{2}$/.test(dateParam)) {
      const currentYear = new Date().getFullYear();
      const dateObj = new Date(`${currentYear}-${dateParam}T12:00:00Z`);
      if (dateObj.getTime()) {
        return {
          monthDay: dateParam,
          formatted: dateObj.toLocaleDateString('en-US', { month: 'long', day: 'numeric' })
        };
      }
    }
    const today = new Date(new Date().toLocaleString('en-US', { timeZone: tz }));
    return {
      monthDay: today.toISOString().substring(5, 10), // MM-DD
      formatted: today.toLocaleDateString('en-US', { month: 'long', day: 'numeric' })
    };
  }
  // Fetch and process the posts
  fetch('/blog/all/index.json')
    .then(response => response.json())
    .then(posts => {
      const dateInfo = getEffectiveDate();
      const dateElement = document.querySelector('h3.date');
      if (dateElement) {
        dateElement.textContent = dateInfo.formatted;
      }
      const matchingPosts = posts.filter(post => {
        const postDate = new Date(post.date).toLocaleString('en-US', { timeZone: tz });
        const postMonthDay = (new Date(postDate)).toISOString().substring(5, 10);
        return postMonthDay === dateInfo.monthDay;
      });

      matchingPosts.sort((a, b) => {
        const dateA = new Date(a.date);
        const dateB = new Date(b.date);
        return dateB - dateA;
      });

      const elem = document.getElementById('posts-container');
      if (matchingPosts.length > 0) {
        const postsHTML = matchingPosts.map(post => {
          const postDate = new Date(post.date).toLocaleString('en-US', { timeZone: tz });
          const postYear = new Date(postDate).getFullYear();
          return `<li>${postYear}: <a href="${post.permalink}">${post.title}</a></li>`;
        }).join('\n');
        elem.innerHTML = `<ul>${postsHTML}</ul>`;
      } else {
        elem.innerHTML = `<p>No posts were written on ${dateInfo.formatted}.</p>`;
      }
    })
    .catch(error => {
      console.error('Error fetching posts:', error);
    });
}
I used to include the day's posts as a footer on
the individual blog post page. That might be
something to consider again.
I write my blog posts in Org Mode and export them
to Eleventy with ox-11ty, which is derived from
the ox-html backend.
Sometimes I want to link to something in a
different blog post. This lets me build on
thoughts that are part of a post instead of being
a whole post on their own.
If I haven't added an anchor to the blog post yet,
I can add one so that I can link to that section.
For really old posts where I don't have an Org
source file, I can edit the HTML file directly and
add an id="some-id" so that I can link to it
with /url/to/post#some-id. Most of my new posts
have Org source, though. I have a
my-blog-edit-org function and a
my-blog-edit-html function in my Emacs
configuration to make it easier to jump to the Org
file or HTML for a blog post.
If the section has a heading, then it's easy to
make that linkable with a custom name. I can use
org-set-property to set the CUSTOM_ID property
to the anchor name. For example, this voice access
section has a heading that has CUSTOM_ID, as you
can see in the . If I don't mind having
long anchor names, I can use the
my-assign-custom-ids function from my config to
automatically set them based on the outline path.
  #+ATTR_HTML: :id interest-development
  That reminds me a little of another reflection
  I've been noodling around on interest development...
Anchor links
It might be fun to have a little margin note with
🔗 to indicate that that's a specially-linkable
section, which could be handy when I want to link
when mobile. It feels like that would be a left
margin thing on a large screen, so it'll just have
to squeeze in there with the sticky table of
contents. I've been meaning to add link icons to
sub-headings with IDs, anyway, so I can probably solve
both with a bit of Javascript.
Text fragments are even more powerful, because I
can link to a specific part of a paragraph. I can
link to one segment with something like
#::text=text+to+highlight~. I can specify
multiple text fragments to highlight by using
#::text=first+text+to+highlight&text=second+text~,
and the browser will automatically scroll to the
first highlighted section. I can specify a longer
section by using text=textStart,textEnd. Example:
#:~:text=That%20is%20the%20gap,described The text
fragments documentation has more options,
including using prefixes and suffixes to
disambiguate matches.
Sometimes automatic subtitle timing tools like
Aeneas can get confused by silences, extraneous
sounds, filler words, mis-starts, and text that
I've edited out of the raw captions for easier
readability. It's good to quickly check each
caption. I used to listen to captions at 1.5x
speed, watching carefully as each caption
displayed. This took a fair bit of time and focus,
so… it usually didn't happen. Sampling the first
second of each caption is faster and requires a
little less attention.
Skimming with subed.el
Here's a function that I wrote to play the first
second of each subtitle.
Now I can read the lines as the subtitles play,
and I can press any key to stop so that I can fix
timestamps.
Skimming with Javascript
I also want to check the times on the Web in case
there have been caching issues. Here's some
Javascript to skim the first second of each cue in
the first text track for a video, with some code
to make it easy to process the first video in the
visible area.
function getVisibleVideo() {
  const videos = document.querySelectorAll('video');
  for (const video of videos) {
    const rect = video.getBoundingClientRect();
    if (
      rect.top >= 0 &&
      rect.left >= 0 &&
      rect.bottom <= (window.innerHeight || document.documentElement.clientHeight) &&
      rect.right <= (window.innerWidth || document.documentElement.clientWidth)
    ) {
      return video;
    }
  }
  return null;
}

async function skimVideo(video=getVisibleVideo(), msecs=1000) {
  // Get the first text track (assumed to be captions/subtitles)
  const textTrack = video.textTracks[0];
  if (!textTrack) return;
  const remaining = [...textTrack.cues].filter((cue) => cue.endTime >= video.currentTime);
  video.play();
  // Play the first 1 second of each visible subtitle
  for (let i = 0; i < remaining.length && !video.paused; i++) {
    video.currentTime = remaining[i].startTime;
    await new Promise((resolve) => setTimeout(resolve, msecs));
  }
}
Then I can call it with skimVideo();. Actually,
in our backstage area, it might be useful to add a
Skim button so that I can skim things from my
phone.
It looks like for EmacsConf talks where we
typically format captions to be one long line each
(< 60 characters), this can be a speed-up of about
4x compared to listening to the video at normal
speed. More usefully, it's different enough to get
my brain to do it instead of putting it off.
Most of the automatically-generated timestamps are
fine. It's just a few that might need tweaking.
It's nice to be able to skim them with fewer
keystrokes.
I'd like to write about code more often. It's easier for people to try
out ideas if they can copy the code without fiddling with selecting
the text, especially on mobile browsers, so "Copy code" buttons on
source code blocks would be nice. I used this tutorial for adding code buttons as a basis for the following CSS and JS code.
First, let's add the buttons with Javascript. I want the buttons to be
visible in the summary line if I'm using the <details /> element. If
not, they can go in the div with the org-src-container class.
Someday I'll figure out how to make it easier to tangle things to the
post's directory and make the file available for download. In the
meantime, this might be a good start.
Now that I have a decent workflow for writing, coding would be the next good thing to reintegrate into my life.
I get about an hour or two of discretionary time a day, late at night once A-‘s asleep. It’s not a solid chunk, since A- often wants to nurse, but I can usually get back to what I was doing without losing too much context. Sometimes A- takes a while to settle down, or wakes up midway. Sometimes I’m too sleepy to do much after A- goes to sleep. Still, I usually get a little time to update my journal, do some consulting, or even play video games with my husband.
How does coding fit into the picture? It’s fun. I learn stuff. Sometimes I even build tools that make my life a little easier. It gives me non-baby things to talk about with W- and other people, too.
The time needs to come from somewhere. What are the trade-offs I might make?
Fewer drawings of non-journal thoughts, balanced by more writing time on phone. Can I figure out a good workflow for drawing on my phone? Not index cards, but maybe I can move my drawing practice to my phone for extra skill-building and mental variety.
Less consulting, but more personal benefits to code; might also use this to expand my comfortable range for consulting
Real-life kaizen vs virtual kaizen: shift by doing real-life kaizen while A- is awake
Other tasks: still do as needed
What could a good setup be like?
I spend some reading time going through documentation, Q&A, research, etc. This helps me improve my skills and work more efficiently.
I have a dev environment set up for risk-free experimentation.
I have a to-do list with prioritized ideas and notes.
I work on tasks that might be 15-30m in size, ideally with tests.
I think it’ll be worth learning how to properly set things up with Vagrant. Frequent rebuilds will force me to make sure all my dev environment assumptions are documented.
It’ll also be worth cleaning up my technical notes and writing more things down, so I can get back up to speed after months or even years away.
Then I’ll want to sort out my testing environment and get back to writing tests. I wonder if I can set things up so that I can even write tests on my phone. Maybe cucumber cases? It’ll be easier to write behaviour-driven tests than regular tests, since I don’t have to mess with punctuation.
Then I can code, one small chunk at a time. Maybe I can even write pseudo code on my phone.
I’d also like to get back to tweaking my environment and tools, since that pays off multiple ways for me: enjoyment, learning, efficiency, and notes to share.
I can start by sorting out my dev environment and notes. We’ll see how that goes, or if this is something that will be mostly on the back burner until A- grows a little more. =)